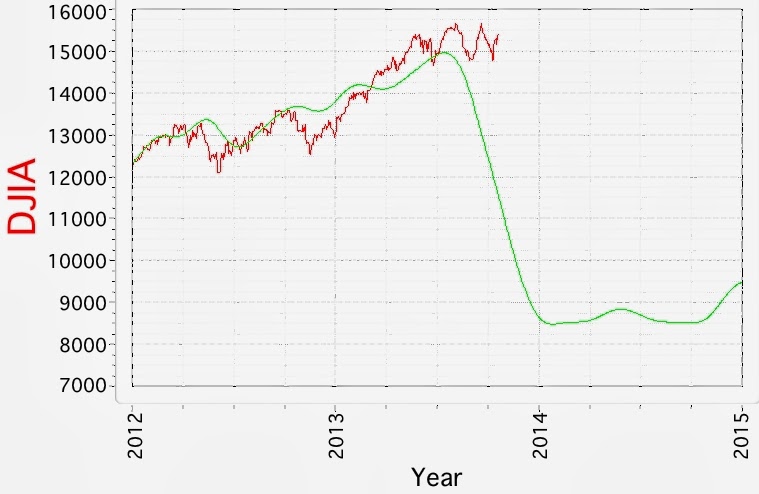

If the DJIA cycle model has any internal validity, based on cycle parameters of the price time series extracted by the model since 1896, the DJIA is once again at a much higher level than would be expected by historical standards. Readers can see the Z-score of the model deviations for comparison to other manic eras. On the other hand, it is also possible that the model is incapable of capturing the recent changes in liquidity managed by the Federal Reserve, and hence it is "broken." In any case, one soft interpretation is that the DJIA is much higher than cyclical patterns indicate it should be, and we should see a very severe correction in the next few months. Nevertheless, given the performance of this particular model to date, I would maintain a skeptical view of the prediction.
3 comments:
Hello Paulo,
I think your work is fantastic and I greatly appreciate you sharing it through your blog. My understanding of cycle analysis is limited, but I wanted to ask a few questions regarding the relationship between your predictive models.
Do your models consider correlations between asset types, such as DJIA to VIX/XOI and silver to gold? I noticed that although the DJIA model suggests a market collapse into EoY, the VIX model appears contradictory given that one would expect this "market fear" indicator to peak at the same time. One might also expect gold and silver to increase strongly as "safe haven" assets.
Likewise the XOI model peaks during mid-2014, which might "correlate" with a market fall delayed by Fed actions and could hence inform the interpretation of the DJIA prediction deviation. I'm also surprised that silver remains depressed while gold appreciates remarkably into 2018, given the past correlations between both (although volatile).
I think what I'm trying to say is that could all of the models could be used together to improve predictions or interpretations?
Kind regards,
Anon
Hi Anon, and thank you for your thoughtful questions, some of which have also been plaguing me as well. The models I present here are purely cyclical structural models which are designed to answer the question of what to expect if the particular time series continues to follow the cyclical pattern. The construct is valid only if there is such a thing as a "business cycle." When I tried a mixed model, with both cyclical as well as other inputs such as 10-year bond rates, the models fell apart, which is documented in the very early iterations on the blog.
However, your suggestions are exactly of the type I use for my intermediate trade models, which are run on a support vector machine setup, much like a neural network. I like to use both gold-silver volatility, SP volatility, interest rates, as well as measures of cross-correlations between target time series. I don't present them here because I currently do not have the time to both run them and prep them for the blog in the short period of time where they retain their usefulness. Of note, however, is that one of the inputs to those models that seems to carry a lot of information is the "error" input from the cycle models I do present here.
Also of interest is that along the lines of your suggestions, I have tried to run gold/silver in the same structural model, since the two models do share some identical cycle parameters - which have been observed during independent runs. However, the linkage does not seem to help with accuracy.
I do ponder the discordance between models, such as between gold and silver, as well as the VIX, and XOI.X. I have redeveloped each of the cycle models from scratch at least a couple of times, and in the case of the precious metals, four times, and come up with the same cycle parameters. The models are robust which of course does not mean they are accurate.
Your comments have given me an idea - which is that I do have some "long-term" neural models that have relatively infrequent trades, and therefore if I post their predictions, they may have be somewhat helpful. I don't tend to run them that often because they are real CPU hogs, and even with 48 CPU cores available to me, they take quite a bit of time to test and run. I am slowly working to automate the data input and develop batch runs, but that is taking more time than I thought.
Thanks for your interest, and keep in touch!
Paolo
Many thanks for your detailed reply Paolo - if you decide to share your longer term neural predictions, I'm sure that they would be greatly appreciated by all!
I suspect that many private investors trade the major indices on a sort of momentum/swing fashion, due to day jobs and other full-time interests.
On a non-scientific basis however, I "think" that your DJIA predictions will come to pass when QE3 starts tapering (or even debt default). That might also influence the timing of the XOI, VIX and gold peaks.
I'm surprised by market bullishness and the Fed "can't fail" attitude. Maybe I'm suffering from the "what goes up, must come down" fallacy, but it seems that something dramatic is around the corner. (Again if one waits long enough, then it is bound to occur eventually.)
Perplexing times,
Anon :-)
Post a Comment